Selecting View > Perforce QAC Analysis Results Window displays the panel shown in the example below. It is populated with diagnostic results when analyzed files are selected in the Files panel of the Perforce QAC Analysis Explorer: Files Panel.
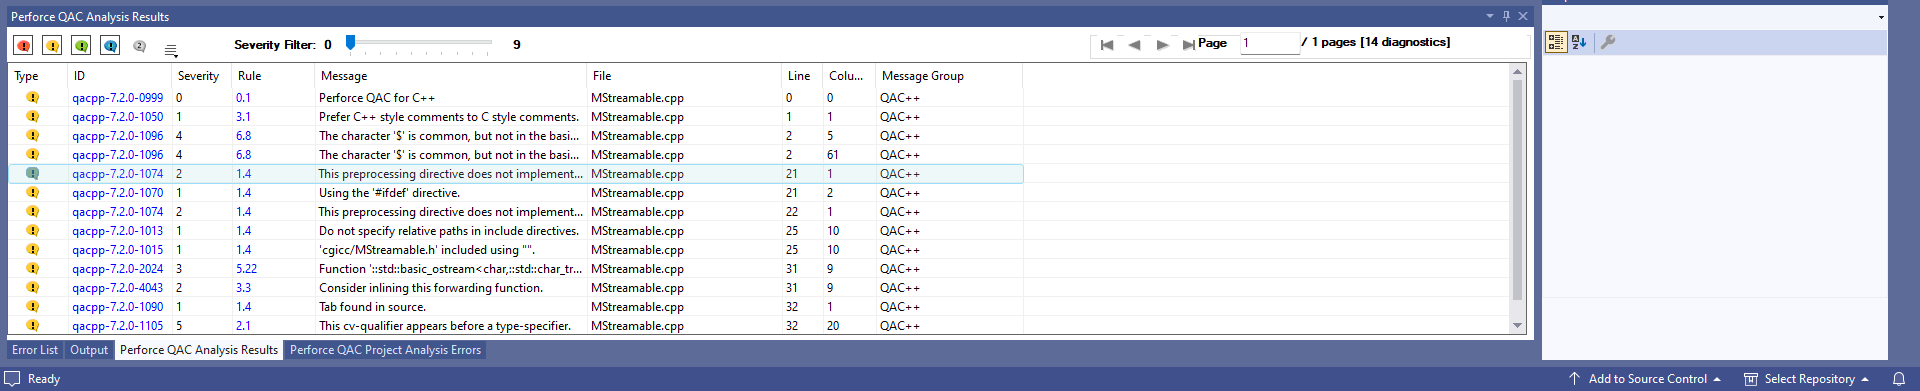
Each message is categorized with the relevant icon:
- Error message (red)
- Warning message (yellow)
- User message (green)
- Information message (blue)
To select a particular category of message for display, select the relevant colored icon in the top left-hand corner of the Perforce QAC Analysis Results panel.
Double-clicking on a row takes you to the specific location of the diagnostic in the Source Code Editor.
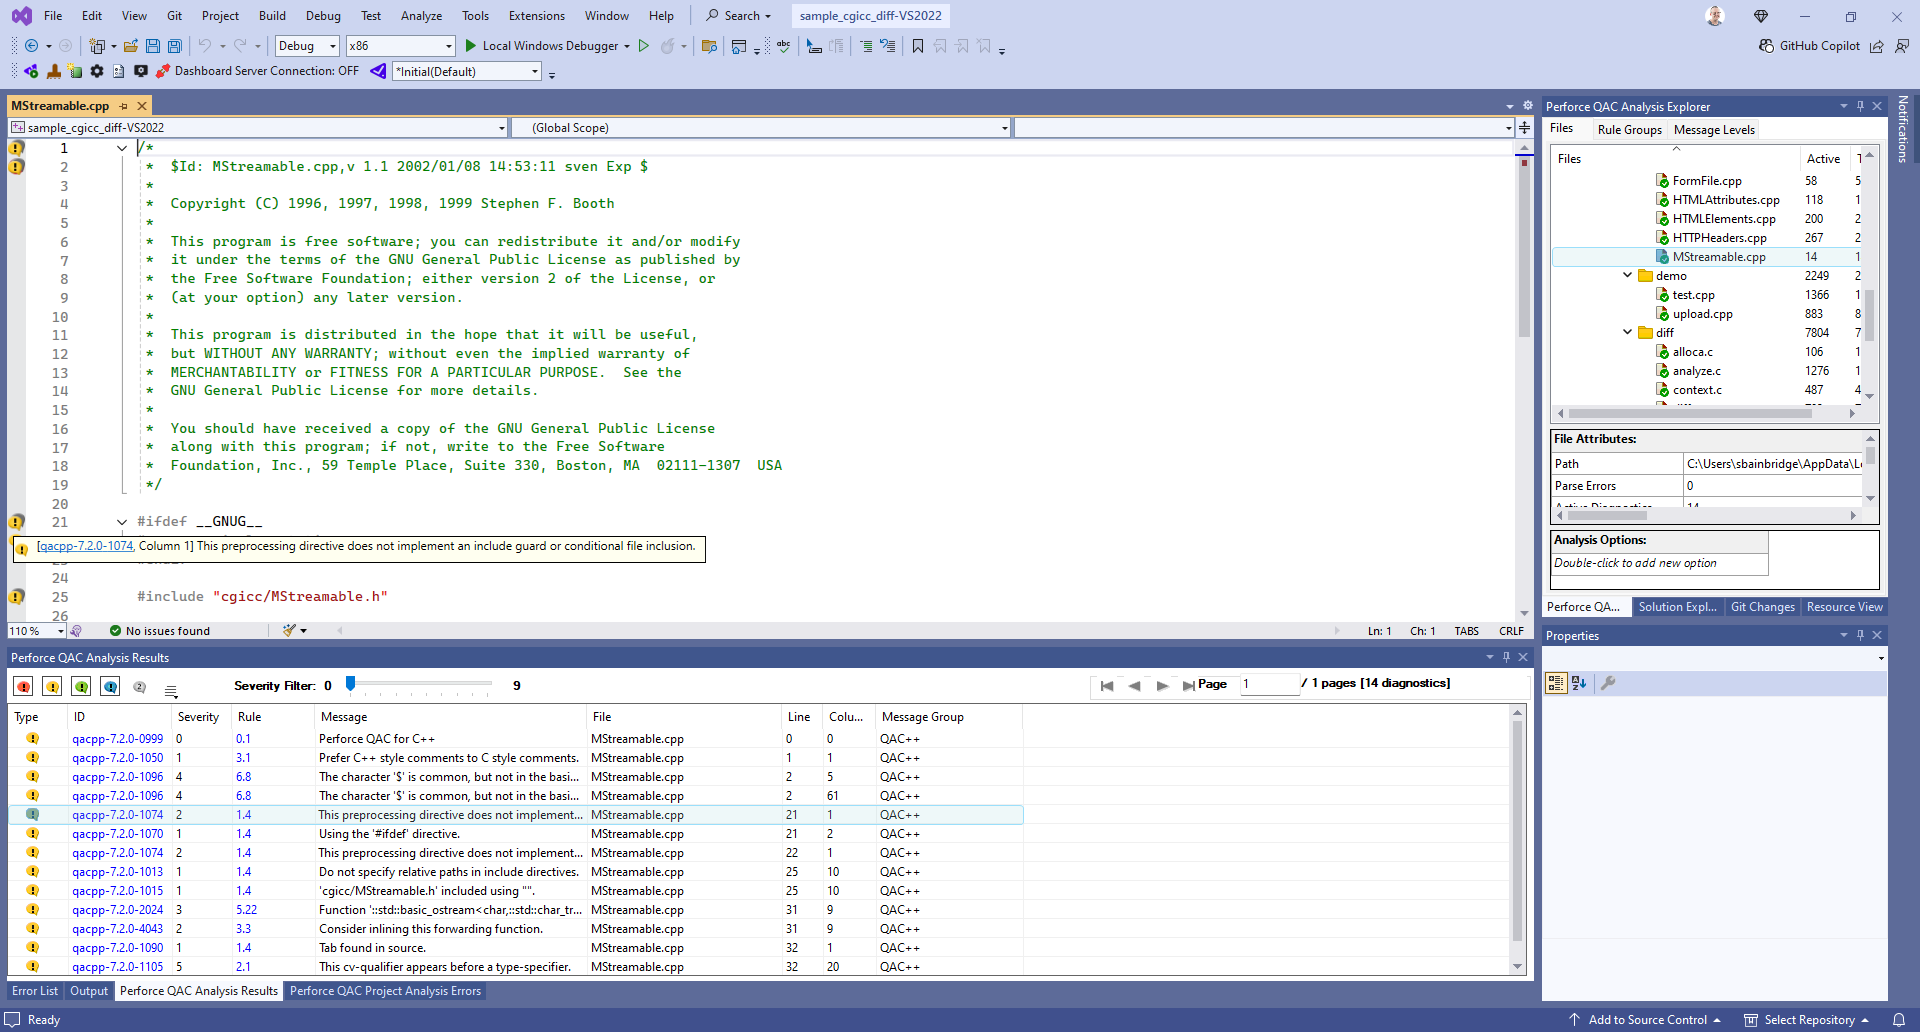
When you click on a hyperlink, the relevant Message or Rule Help is displayed in your default browser.
To display Message Help for an entry in the results view , select the entry and press the F1 key.